Why ARR Alone Won’t Drive Market Cap: A Deep Dive into Monday.com vs. SimilarWeb
Unpacking the metrics behind ARR efficiency and market value for B2B SaaS.
1. Intro
As product leaders, our primary goal is to build and grow businesses, which ultimately means maximizing their dollar value.
However, simply driving ARR isn’t enough. It’s not only about the absolute ARR ($) generated but also how effectively your startup generates that ARR. This is just as critical in determining the business dollar value.
Hence, to truly call yourself the ‘CEO of the product,’ you need to think like one. This involves approaching ARR through the lens of Product and wearing the VC/CFO hat to ensure we spin the revenue flywheel effectively and sustainably.
In this blog post, I’ll explore why Monday.com’s market value per $1 in ARR is 5.13 times that of SimilarWeb’. The insights from this exploration are applicable to any B2B SaaS startup.
2. Before we start
Monday.com helps teams organize and track their work, making it easy to manage projects, tasks, and team collaboration all in one place.
Similarweb provides data about website and app traffic so businesses can understand their online performance and stay competitive in their industry.
Both Monday.com and SimilarWeb are:
Public
B2B SaaS
Growing
Profitable!
Market Leaders
Rocking an amazing culture
To analyze the 5X gap in market value per $1 ARR, I will explore the following metrics and benchmarks using public investor relations data from Q2FY24 :
Gross Margin (Non-GAAP)
Operating Margin (Non-GAAP)
Free Cash Flow (FCF)
CAC Payback
Net Revenue Retention (NRR)
ARR Growth (%)
Rule of 40 (Ro40)
3. Margins
Gross Margin (Non-GAAP):
What is that?
After covering the Cost of Goods Sold (COGS) - infrastructure costs, third-party licensing, etc. the company keeps X cents for every dollar of revenue.
Yes, Monday.com’s margins (91%) tend to be higher compared to SimilarWeb (81%) primarily because SimilarWeb operates as both a SaaS (Software as a Service) and a DaaS (Data as a Service) company.
The DaaS model relies heavily on data acquisition, which involves substantial ongoing costs for purchasing, processing, and maintaining extensive data sets. These data-related expenses directly impact the Cost of Goods Sold (COGS), making them a recurring cost that lowers SimilarWeb’s gross margin relative to companies with purely software-based models.
Operating Margin (Non-GAAP):
What is that?
After covering COGS and operating expenses - R&D, marketing, sales, etc. the company keeps X cents for every dollar of revenue.
Monday.com’s operating margin stands at 16%, while SimilarWeb has reached 9% -both having transformed their once-negative margins into positive territory.
SimilarWeb, by default, had a tougher journey to positive operating margins due to the higher COGS inherent in their data-cost-intensive model. Yet they still achieved profitability despite allocating a similar percentage of revenue to R&D as Monday.com (the low 20’s) and overspending by 10% on Sales and Marketing.
However, to fully change the sentiment around its market cap, SimilarWeb will need to sustain double-digit margins over at least a few quarters two quarters.
4. Free Cash Flow (FCF).
What is it?
Free Cash Flow (FCF) is the available chunk of cash (as a % of revenue) that a company can use to invest in growth.
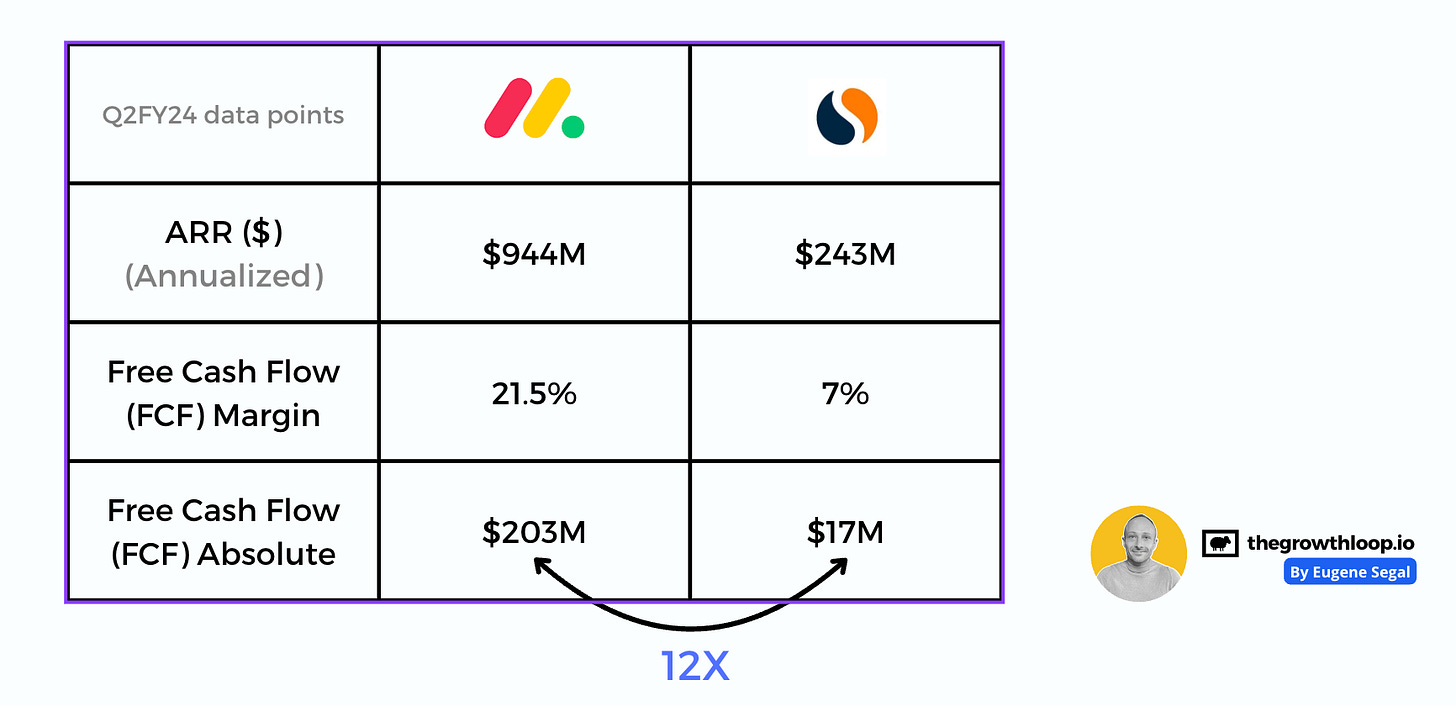
Monday.com’s free cash flow (FCF) margin of 21.5% translates to over $200M annually, while SimilarWeb’s lower FCF margin of 7% totals around $17M annualy. Thanks to Monday’s higher ARR and FCF, there’s a 12X difference in absolute annualized free cash flow. In other words, Monday has 12 times more cash to invest in growth. It’s impressive.
5. CAC Payback
What is it?
CAC Payback is the time required to recover customer acquisition costs. A shorter payback period indicates quicker returns and enables faster reinvestment.
Monday.com’s CAC payback period averages 12 months across all ACV segments, while SimilarWeb’s ranges between 18 and 24 months.
SimilarWeb’s ACV composition is heavily skewed toward Enterprise, with 60% of its ARR coming from customers with $100k+ ACV. This leads to longer sales cycles and higher upfront investments in acquisition and onboarding. In contrast, Monday.com generates only 30% of its revenue from $50k+ mid-market/enterprise customers, layering an efficient Product-Led Growth (PLG) strategy for SMB acquisition and expansion with a high-touch approach for larger, high-ACV accounts. As a result, Monday.com’s payback cycles are nearly twice as fast as SimilarWeb’s.
Think about it: if you have 12X more free cash flow (FCF) to invest and can recoup your investment twice as fast through CAC payback, you’re operating at supersonic speed.
6. Net Revenue Retention (NRR)
What is it?
Net Revenue Retention (NRR) is the percentage of recurring revenue retained and expanded from existing customers over time.
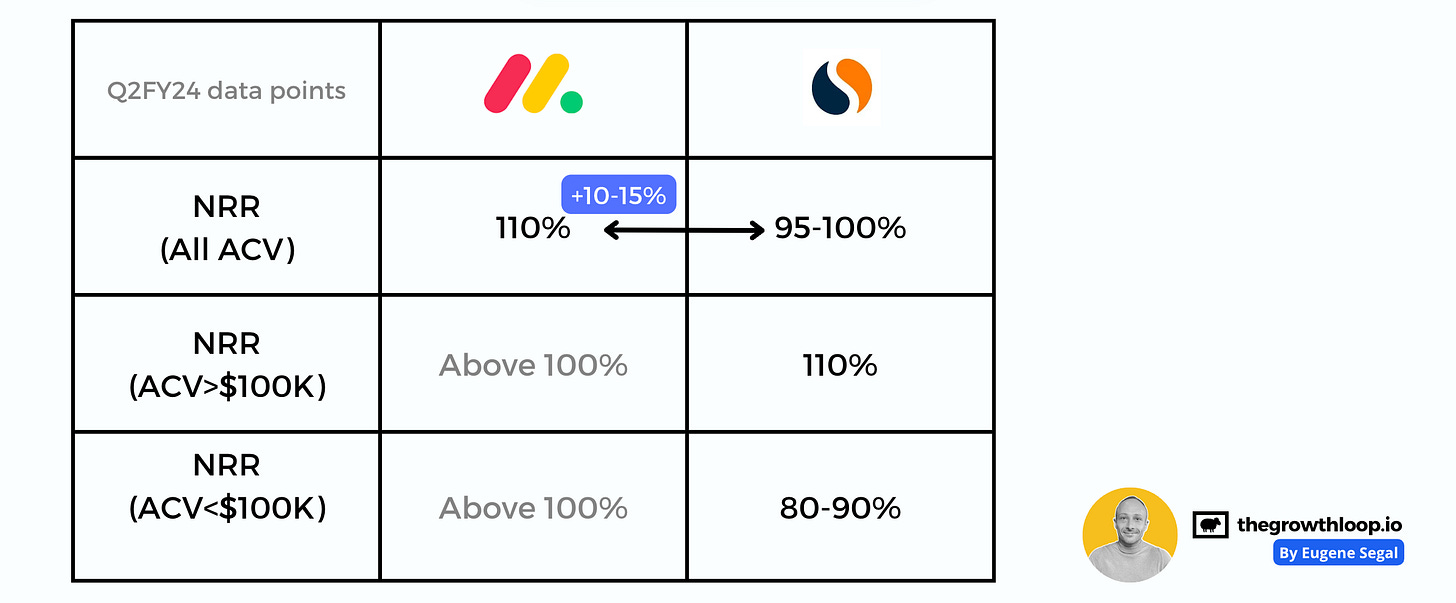
Monday.com boasts an NRR of 110% across all ACV segments, reflecting strong expansion within its existing customer base.
SimilarWeb, while also achieving 110% NRR, only reaches this level with customers whose ACV is over $100K—who, as mentioned, contribute 60% of their revenue. For customers with ACVs under $100K, however, SimilarWeb’s NRR drops to between 80% and 90%, pulling their overall NRR down to 99%.
This means a significant churn issue within SimilarWeb’s sub-$100K segment, forcing them to rely heavily on new customer acquisition to drive growth.
7. ARR Growth (%)
What is it?
ARR Growth is the percentage increase in recurring revenue from new and existing customers over time.
Compared to SimilarWeb, Monday retains more of every dollar earned, has more free cash for growth, recoups investments faster, and sees expansion across all ACV segments—all driving higher ARR growth.
To put this in perspective, Monday.com’s 34% year-over-year revenue growth is 2.5 times SimilarWeb’s 13%, a 19% delta that compounds significantly. Over ten cycles, compounding 34% growth results in an 18.6X multiplier, while 13% growth reaches only 3.4X.
Finally, let’s apply the Rule of 40 (Ro40) which balances between growth and profitability and provides another benchmark for how effective and sustainable is the ARR machine. If the Ro40 is 40% or higher, it indicates a healthy and sustainable ARR engine.
Monday.com:
34% (ARR Growth) + 16% (Operating Margin) = 50%
// Above the 40% benchmark.
SimilarWeb:
13% (ARR Growth) + 9% (Operating Margin) = 22%
// Below the 40% benchmark.
8. Final Words.
I will re-iterate. How effectively a startup generates ARR is just as important as how much ARR it generates.
Although Monday.com is an overperformer, this doesn’t mean SimilarWeb is underperforming. SimilarWeb has a strong team, and their ARR effectiveness improves with each quarter—I’m personally bullish on their success. SimilarWeb has the potential to double its market cap in the next 12 months by:
Elevating operating margins to double digits and maintaining this level quarter over quarter.
Reducing the payback period to an average of 18 months.
Increasing the NRR for ACV <$100k (currently impacted by churn) from the mid-80s to the high 90s while keeping the NRR for ACV >$100k steady at 110%.
Beyond the ARR effectiveness, there are, of course, other considerations impacting startups’ market cap, such as TAM, Defensibility Moats, and the proven ability to execute Horizontal and Vertical Expansion. But this is out of the scope of this blog post.


@Eugene Segal, your analysis brilliantly captures the deeper truth behind ARR: it’s not just the numbers, but the quality of those numbers that defines market success.
The way metrics like CAC payback and NRR compound over time isn’t just a finance lesson—it’s a masterclass in scaling with precision and purpose. It’s a call to stop chasing vanity metrics and start building ARR engines that run sustainably and efficiently.
For founders and leaders: are you measuring what truly matters, or are you still chasing growth at any cost?
To @Eugene: what’s the single most overlooked metric you believe SaaS startups should prioritize to unlock ARR efficiency?